WLWatchman Manual :: the WLWatchman Console |
- A quick tour around the console
- Generating a new configuration
- Choosing what to include and what not to
- Now what?
A quick tour around the console | ||
The WLWatchman console will load the file wlwatchman-config.xml in the current directory, if it finds it, otherwise the console starts up blank. Figure 1, below, shows the console with a 2-server domain configuration loaded.
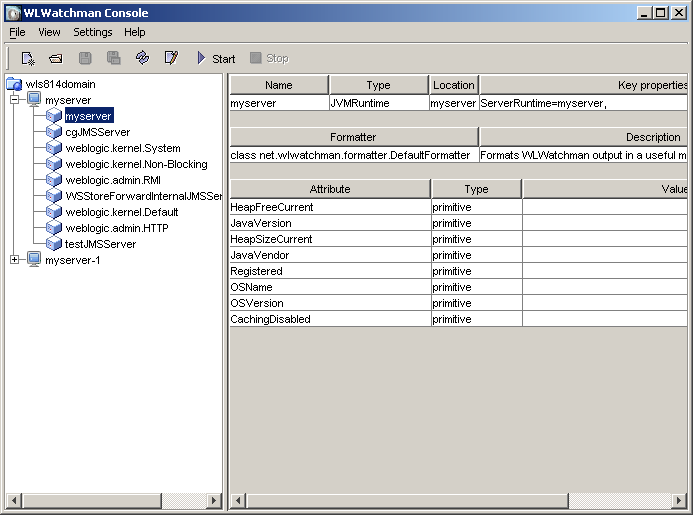
| Figure 1. The WLWatchman console with a two server config file loaded |
By default, the console starts up in the Configuration View, as shown. This view, described in more detail here allows you to examine the configured MBeans, whereas the Graphs View, shown in Figure 2 and detailed here allows you to chart in real-time the attribute state. A third view, the Alerts View, is not yet implemented.
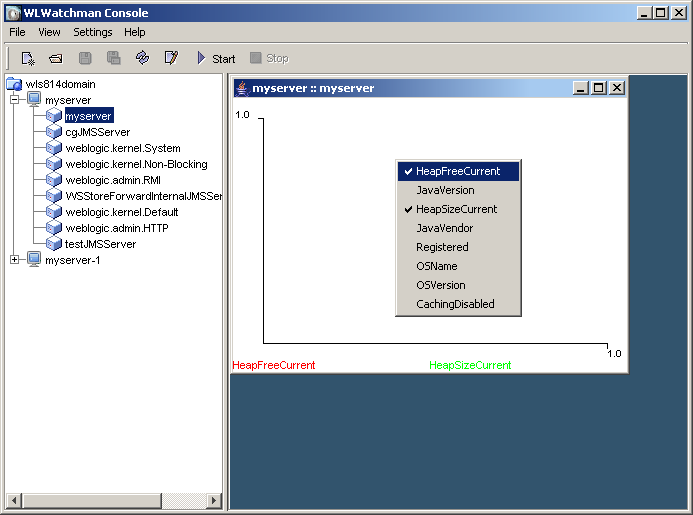
| Figure 2. The WLWatchman console in graph mode, showing the chart for a JVMRuntime MBean. |
Each view contains on the left a tree view, giving a overview of the domain objects. This shows the top-level domain node, which has a child node for each configured server. Each server has child nodes for the configured MBeans. Clicking on any of these MBean nodes causes the right-hand side of the console to display information relevant to that MBean, so in the Configuration View you'll see the current state of the MBean and its configured attributes; in the Graphs View clicking on the MBean will cause the chart window for that MBean to be displayed.
Note that when we say "configured" here, we are referring to the WLWatchman configuration, not the WebLogic domain abd server configurations; the WLWatchman configuration contains a subset of the servers and MBeans that are available in the domain but it is not usually the full set; for example, many people are not interested in what the admin server is doing in a cluster as the load on it is usually light so in these situations, the admin server would be manually removed from wlwatchman-config.xml. Similarly, every servlet or compiled JSP has a ServletRuntime associated with it and in a Portal domain these can be overwhelming, simply by the sheer number of them. For this reason there is the facility to ignore certain specific runtime MBean types when constructing wlwatchman-config.xml or to only include MBeans in which you are specifically interested, such as JVMRuntime or ExecuteQueueRuntime if you want to monitor the heap free space or numbers of idle threads, for example.
The console Toolbar, from left to right contains the buttons listed in the following table. These are all shortcuts to functionality contained in the menus off the main menubar.
 |
Create a new configuration |
 |
Open an existing configuration |
 |
Save the current configuration |
 |
Save the current configuration as a new file |
 |
Reload the current configuration |
 |
Edit the current runtime settings |
 |
Start a monitoring session |
 |
Stop the current monitoring session |
Generating a new configuration | ||
First things first, start up the servers in your domain. You need at least your Admin server running but if you don't have any managed servers running, WLWatchman won't be able to query them and you'll get no information back. Which isn't a particularly good way to determine what's going on.
Once the servers are all up and running, start the console and click on the New Configuration button on the toolbar or choose File>New from the menu. This brings up the dialog below.
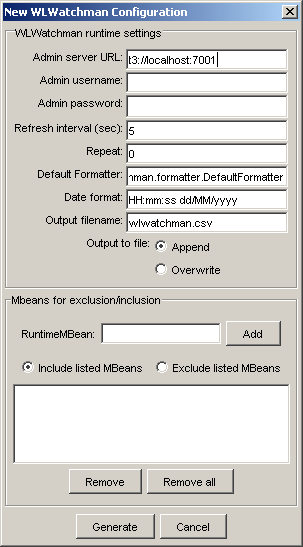
| Figure 3. The new configuration dialog. |
The entries in this dialog are fairly self-explanatory; the absolute minimum you need do - if your admin server is running on localhost:7001 - is enter the domain system administrator username password for the domain and click "Generate". For the samples domains, the username and password are both weblogic. After a while, the console will present you with a save as dialog to save your newly generated configuration and then display it. Note: you have to save the configuration in order to view it
Once you've saved your new configuration, it will be displayed in the console and look similar to figure 1 except it will probably show rather more objects...
Choosing what to include and what not to | ||
Every runtime service, such as a JDBC Connection Pool and every J2EE managed object, such as a servlet or EJB, has an associated RuntimeMBean. As you might imagine, this leads to rather a lot of MBeans! You will in all likelihood not be interested in every single RuntimeMbean on offer. Many of them do not give you information which will be of use to you in monitoring a system. You'd have to be doing some fairly specific monitoring to want to keep an eye on the low, average and high execution times on a ServletRuntimeMBean for example. Furthermore, given that every servlet has one, this means that every JSP has one - and every JSP fragment also. In a WebLogic Portal application, that can mean dozens of ServletRuntimeMBeans, if not more.
The new configuration dialog allows you to pick and choose what RuntimeMBeans to include - or to exclude. Simply enter the type of MBean, say TaskRuntimeMBean in the text field in the lower part of the dialog and click on "Add". This is added to the list of MBeans shown in the listbox below. Whether this list is the list of only those MBeans that are queried, or whether it is the list of MBeans that are ignored - all others being queried - is determined by the "include"/"exclude" radio buttons. Clicking on "Remove" will remove the currently selected MBean from the list; "Remove all" does what it says. It is case-sensitive, though you can omit the "MBean" suffix and WLWatchman will add it on for you.
The configuration shown in Figures 1 and 2 was generated with ExecuteQueueRuntimeMBean, JVMRuntimeMBean and JMSServerRuntimeMBean in the list and "include" selected. As you can see, the MBeans are not grouped according to type, nor arranged alphabetically in the tree. This may be written into a future release.
Now what? | ||
Well, now you have a WLWatchman configuration generated with only the types of MBeans you're interested in. As far as this documentation goes, from here you have a number of choices; you can have a look at the configuration view, the graphs view, at some technical details, the wlwatchman-config.xml structure and some samples or get on and start monitoring your domain.